


This article is part 1 of a series that will provide you with a comprehensive guide on how you can troubleshoot and identify root cause of Java high CPU problems.
This guide is also applicable for standalone Java programs but designed to help individuals involved in day to day Java EE enterprise production support. It will also include the list of the most common high CPU problems along with high level resolution strategies.
Production problems resolution mindset review
Before we go any further, it is important to review your production problem resolution mindset. One of the most common “reflexes” that I have seen in my experience with Java EE production support teams is that Java VM / middleware restart is often the first recovery action that is performed. While a premature restart can quickly eliminate the business impact, it can also prevent you to get all the technical facts; reducing your capability to identify the root cause and exposing the platform to future re-occurrences of the problem.
Before pulling the trigger and shutdown your Java VM process, ask yourself the following question: do I have all the data available to perform a root cause analysis post restart? If the answer is no then my recommendation to you is to review and improve your current platform monitoring and / or troubleshooting approaches. Proper performance data gathering before and during a high CPU problem is critical.
Java high CPU – what is it exactly?
Now back to our original topic, a high CPU problem is defined by an observation of one or many Java VM processes consuming excessive CPU utilization from your physical host(s). Excessive CPU can also be described by an abnormal high CPU utilization vs. a known & established baseline. Ex: if the average CPU utilization of your Java VM under peak load condition is 40% then excessive CPU threshold can be set around 80%.

A typical Java VM process contains several Java Threads, some waiting to do work and others currently executing tasks. The # of Threads can be very low in the event of a single Java program and very high for Java EE enterprise platforms processing heavy concurrent transactions.
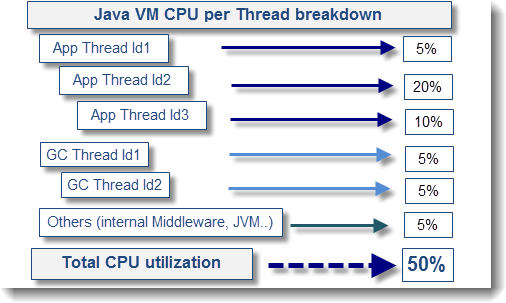
In order to understand and identify the source of high CPU of one or many of your Java processes, you will need to understand and perform a full breakdown of all Threads of your Java VM so you can pinpoint the biggest contributors. This analysis exercise can be visualized as per below diagram.
Understand your average CPU utilization
As I mentioned in the earlier section, it is very important that you understand your current average CPU utilization, what I refer as a baseline. This is crucial data that needs to be monitored on a regular basis as part of a comprehensive and ongoing platform capacity planning strategy.
Proper understanding and tracking of your average and “healthy” CPU utilization observed from your Java VM processes will allow you to quickly detect abnormal CPU surge scenarios and correlate with possible root causes (problem introduced by a project, unexpected load increase etc.). Finally, this will provide you with proper threshold values necessary to configure pro-active CPU related alerts using monitoring tools of your choice.
Understand your production environment and available tools
As the middleware and / or application support prime, you really need to understand your production environment, including the out-of-the-box tools available for you to perform low level troubleshooting tasks. This may be trivial for some individuals but if you just recently started to work on a new Java or Java EE platform for a new client, my recommendation is that you should spend enough time understand your client’s environment specifications & business situation as per below:
- Physical & virtual host configuration and capacity (total # of assigned CPU cores, RAM etc.)
- OS vendor, version and patch level
- Middleware vendor, versions and patch level
- Java vendor & versions (including 32-bit vs. 64-bit); including patch level
- Third party API’s used within the Java or Java EE applications
- Existing monitoring tools that you can leverage for historical data and trend analysis
- History of the environment, known issues, resources utilization etc.
- Business traffic breakdown per application along with average and peak traffic level of the platform; including peak business periods
Collecting all proper facts as per above will definitely help your root cause analysis process going forward; including for high CPU related problems.
Your homework before jumping to the part 2
Before we jump into the part 2 of this CPU troubleshooting guide, I highly recommend that you study and understand each the following articles below. Focus on the ones applicable for your environment. Each of these articles will provide you with a technical step by step on how to breakdown CPU per Thread for a Java VM; a key troubleshooting skill to acquire in order to investigate Java CPU related problems. This technique is common on some aspects and specific depending of the OS.
# CPU per Thread analysis on Solaris
# CPU per Thread analysis on Linux
# CPU per Thread analysis on AIX
# CPU per Thread analysis on Windows
I hope this article has provided with a good starting point on Java CPU problems. The part 2 will provide you with the troubleshooting guide which will include flow diagrams allowing you to choose the right investigation path depending of your problem case.
Please do not hesitate to post any comment or question.