


The
following question will again test your knowledge of the Oracle Weblogic
threading model. I’m looking forward for your comments and experience on the
same.
If you are
a Weblogic administrator, I’m certain that you heard of this common problem: stuck
threads. This is one of the most common problems you will face when
supporting a Weblogic production environment.
A Weblogic
stuck thread simply means a thread performing the same request for a
very long time and more than the configurable Stuck
Thread Max Time.

Question:
How can
you detect the presence of STUCK threads during and following a production
incident?
Answer:
As we saw
from our last article “Weblogic
Thread Monitoring Tips”, Weblogic provides functionalities allowing us to
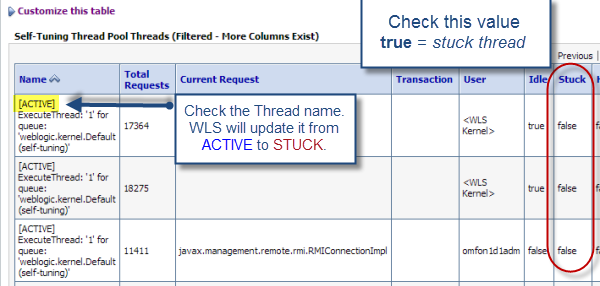
closely monitor its internal self-tuning thread pool. It will also highlight
you the presence of any stuck thread.
This
monitoring view is very useful when you do a live analysis but what about after
a production incident? The good news is that Oracle Weblogic will also log any detected
stuck thread to the server log. Such information includes details on the
request and more importantly, the thread stack trace. This data is crucial and
will allow you to potentially better understand the root cause of any slowdown
condition that occurred at a certain time.
<Sep
25, 2013 7:23:02 AM EST> <Error> <WebLogicServer>
<Server1> <App1>
<[ACTIVE]
ExecuteThread: '11' for queue: 'weblogic.kernel.Default (self-tuning)'>
<BEA-000337>
<[STUCK] ExecuteThread: '35' for queue: 'weblogic.kernel.Default
(self-tuning)' has been busy for "608" seconds working on the request
"Workmanager:
default, Version: 0, Scheduled=true, Started=true, Started time: 608213 ms
POST
/App1/jsp/test.jsp HTTP/1.1
Accept:
application/x-ms-application...
Referer:
http://..
Accept-Language:
en-US
User-Agent:
Mozilla/4.0 ..
Content-Type:
application/x-www-form-urlencoded
Accept-Encoding:
gzip, deflate
Content-Length:
539
Connection:
Keep-Alive
Cache-Control:
no-cache
Cookie:
JSESSIONID=
]",
which is more than the configured time (StuckThreadMaxTime) of "600"
seconds. Stack trace:
<Application Execution Stack Trace>
...................................
javax.servlet.http.HttpServlet.service(HttpServlet.java:727)
javax.servlet.http.HttpServlet.service(HttpServlet.java:820)
weblogic.servlet.internal.StubSecurityHelper$ServletServiceAction.run(StubSecurityHelper.java:227)
weblogic.servlet.internal.StubSecurityHelper.invokeServlet(StubSecurityHelper.java:125)
weblogic.servlet.internal.ServletStubImpl.execute(ServletStubImpl.java:301)
weblogic.servlet.internal.ServletStubImpl.execute(ServletStubImpl.java:184)
weblogic.servlet.internal.WebAppServletContext$ServletInvocationAction....
weblogic.servlet.internal.WebAppServletContext$ServletInvocationAction.run()
weblogic.security.acl.internal.AuthenticatedSubject.doAs(AuthenticatedSubject.java:321)
weblogic.security.service.SecurityManager.runAs(SecurityManager.java:120)
weblogic.servlet.internal.WebAppServletContext.securedExecute(WebAppServletContext.java:2281)
weblogic.servlet.internal.WebAppServletContext.execute(WebAppServletContext.java:2180)
weblogic.servlet.internal.ServletRequestImpl.run(ServletRequestImpl.java:1491)
weblogic.work.ExecuteThread.execute(ExecuteThread.java:256)
weblogic.work.ExecuteThread.run(ExecuteThread.java:221)
Here is
one more tip: the generation and analysis of a JVM thread dump will also
highlight you stuck threads. As we can see from the snapshot below, the
Weblogic thread state is now updated to STUCK, which means that this particular
request is being executed since at least 600 seconds or 10 minutes.

This is
very useful information since the native thread state will typically remain to
RUNNABLE. The native thread state will only get updated when dealing with
BLOCKED threads etc. You have to keep in mind that RUNNABLE simply means that
this thread is healthy from a JVM perspective. However, it does not mean that it truly is from a middleware or Java EE container perspective. This is why
Oracle Weblogic has its own internal ExecuteThread state.
Finally,
if your organization or client is using any commercial monitoring tool, I recommend
that you enable some alerting around both hogging thread and stuck thread. This
will allow your support team to take some pro-active actions before the
affected Weblogic managed server(s) become fully unresponsive.